
Within the retail technology landscape, digital signage is no longer just a visual tool, it’s a dynamic platform that can directly influence consumer behavior.
To truly maximize its impact, digital signage strategies must be informed by robust research and data analytics. We are leading the way in leveraging both qualitative and quantitative research methods during the pilot phases of projects to get valuable insights into optimal display placement and content for each specific brand, turning signage into a powerful and personal driver of engagement and sales.
The Power of Data in Digital Signage Strategy
Our research is leading to data-driven decision-making that is transforming how businesses deploy digital signage. By analysing customer behaviour, foot traffic patterns and sales data, we work with retailers to tailor their messaging and display placement to resonate with different shopper segments, ultimately enhancing the customer journey. Our research aligns with Byron Sharp’s principles that businesses should aim to reach a broad audience, not just loyal customers. By analysing customer behaviour across different segments and optimizing digital signage for all types of shoppers, we are creating more efficient, mass-reach strategies that lead to consistent sales growth. The principles from the Ehrenberg-Bass Institute emphasize the need to cater to all potential buyers in-store, making signage placement and messaging that reaches light and infrequent shoppers just as important.
The days of installing screens based on intuition or generic best practices are over! Today, it’s all about precision and measurable impact.
Combining Qualitative and Quantitative Research: A Holistic Approach
To inform effective digital signage strategies, it’s essential to combine both qualitative and quantitative research methods. Quantitative data provides the hard numbers—sales figures, footfall metrics, and engagement rates, while qualitative insights offer a deeper understanding of customer behavior and preferences. Recent research by Karen Nelson-Field on the attention economy highlights that attention is a scarce resource, and brands must fight to capture it. Through the use of A/B testing and real-time tracking, we ensure that digital signage maximizes attention by placing messages in locations where customers are most likely to engage. Understanding how customers’ limited attention spans interact with in-store displays ensures we make every impression count.
Quantitative Research: Measuring What Matters
- Sales Data Analysis
By linking point-of-sale (POS) data with the content displayed on screens, businesses can determine which messages drive sales and which fall flat. For instance, testing different promotional messages in various store zones and measuring the resulting sales uplift can reveal the most effective content strategies.
- Footfall Tracking and Heat Mapping
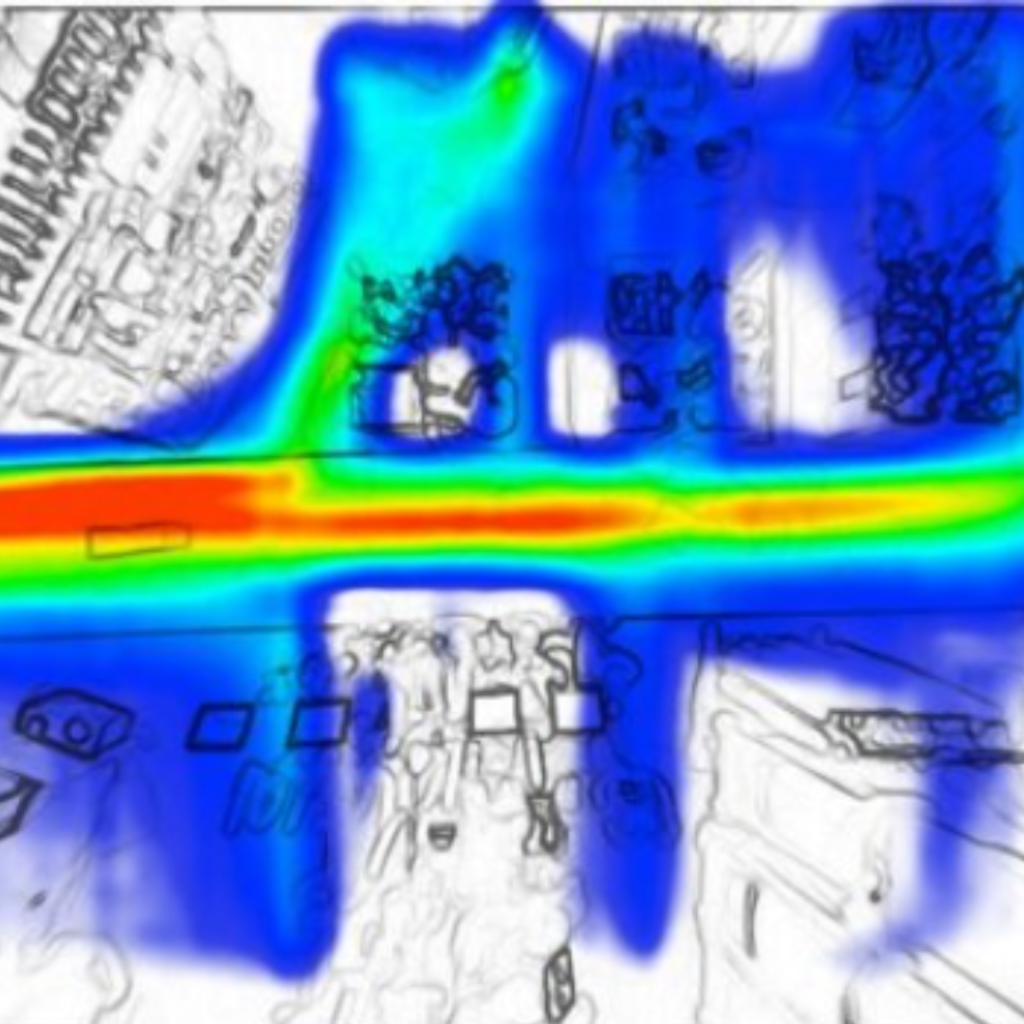
Advanced analytics tools can track customer movements within the store, identifying high-traffic zones where signage can have the greatest impact. Heat maps provide visual insights into how customers navigate the space, helping to pinpoint optimal display locations.
- A/B Testing Content
A/B testing allows retailers to experiment with different types of content, display locations and messaging styles to see which combinations yield the best results. This approach helps refine strategies based on real-world performance data rather than assumptions.

Qualitative Research: Understanding the Customer Experience
- Eye-Tracking Studies
Deep learning eye-tracking technology uncovers how customers interact with digital displays in real time, revealing what grabs their attention and what they overlook. This data is crucial for understanding the effectiveness of display placement and the design elements that resonate most with shoppers.

- Exit Interviews and Focus Groups
Engaging directly with customers through exit interviews or focus groups provides valuable feedback on their in-store experiences. These insights can highlight areas for improvement in both content and display positioning, ensuring that the digital signage strategy aligns with customer needs and expectations.
- Behavioural Observations:
Observing customer behaviour can provide subtle clues about how signage influences decision-making. Are shoppers stopping to read promotions, or are they quickly moving past displays? Understanding these behaviours helps fine-tune content and optimize placement.
Our Data-Driven Insights in Action
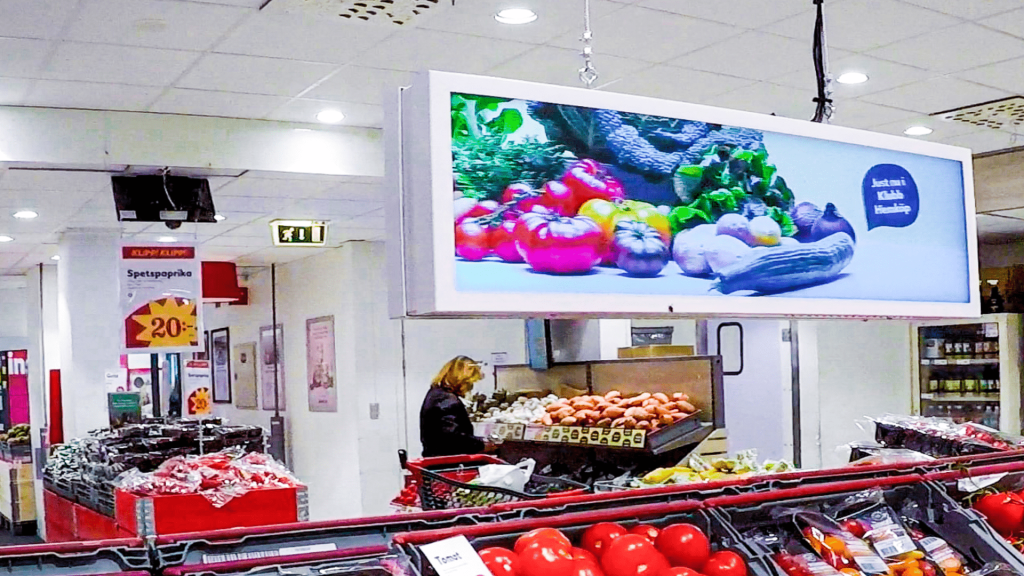
One key finding from combining these research methods is that the traditional approach to signage placement—installing screens high up for maximum visibility—is not always the most effective. Research shows that displays placed at eye level and closer to the point of decision-making, such as near product shelves, can significantly enhance engagement and sales.
For instance, data revealed that signage positioned on the left side of aisles captured more attention than displays on the right, which aligns with shopper-marketing research showing that shoppers often push shopping carts with their right hand while using their left hand to grab items. This naturally leads to more focus on the left side of the aisle. Similarly, screens placed lower and closer to eye level were more effective than those mounted higher. These findings challenge established signage norms and underscore the importance of evidence-based placement strategies.
How To Turn Insights into Action

- Leverage Data Dashboards
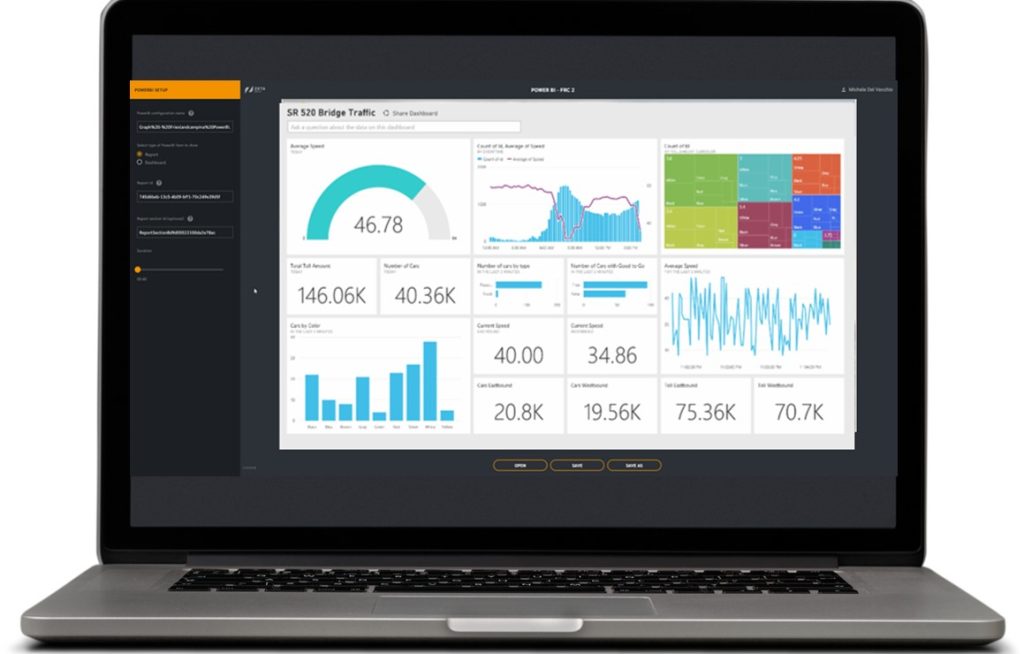
Use custom analytics dashboards that consolidate data from multiple sources—sales, footfall, heat maps, and customer feedback. This centralized view enables real-time decision-making and more agile content management.
- Personalize Content Based on Data Insights
Tailor your messaging to different shopper types identified through research, such as quick-trip, top-up, or big-trip shoppers. For example, highlight quick deals for time-strapped customers or suggest related products for those on a larger shopping trip.
- Regularly Update and Test Content
Continuously measure the impact of your digital signage through A/B testing and adjust content based on what works. Use insights from eye-tracking studies and customer feedback to refine visuals, messaging, and calls to action.
- Optimize Display Placement
Use footfall data and heat maps to place displays where they will be most effective—at decision points, high dwell areas, or near complementary products. Reassess placement regularly as store layouts and shopper behaviours evolve. By following Byron Sharp’s findings on mental and physical availability, we ensure that signage is not just placed for maximum visibility but is strategically positioned to meet customers at crucial decision points. This approach creates mental availability by ensuring that the brand is top-of-mind and one can find and shop the brand when shoppers are most likely to make a purchase, which supports the goal of consistent sales uplift.
The Future of Data-Driven Digital Signage

As technology advances, the integration of AI and machine learning will further enhance the ability to analyse and predict customer behaviour, making digital signage even more responsive and personalized. The future of digital signage lies in continually adapting to real-time data, ensuring that every display serves a strategic purpose.
Retailers who embrace data-driven approaches to digital signage placement and content strategy will not only improve the customer experience but also drive measurable business outcomes. By harnessing the power of research and analytics, digital signage can evolve from a static communication tool to a dynamic, impactful part of the retail environment.
* Insights derived from Nelson-Field (2020) The Attention Economy and How Media Works, Sharp (2010) How brands grow, Underhill (2009) in Why We Buy: The Science of Shopping, Stroebele and de Castro (2004) and qualitative and quantitative studies performed by ZetaDisplay from 2017 to 2024.
